A speed - time graph shows us how the speed of a moving object changes with time.
• The steeper the graph, the greater the acceleration.
• A horizontal line means the object is moving at a constant speed.
• A downward sloping line means the object is slowing down.
A distance-time graph tells us how far an object has moved with time.
• The steeper the graph, the faster the motion.
• A horizontal line means the object is not changing its position - it is not moving, it is at rest.
• A downward sloping line means the object is returning to the start.
Speed-Time Graphs
|
|
|
|
Object is at a constant speed. A straight horizontal line on a speed-time graph means that the speed is constant. It is not changing over time.There is movement at a constant speed.
|
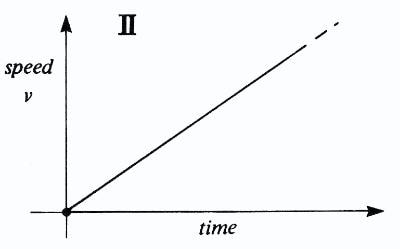
Object is increasing in speed. This graph shows increasing speed. The moving object is accelerating.
|
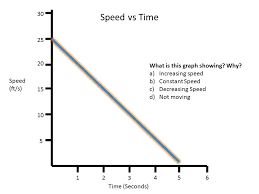
Object is decreasing in speed. this graph shows decreasing speed. The moving object is decelerating.
|
Distance-Time Graphs
|
|
